
Version Française: cliquez ici
|
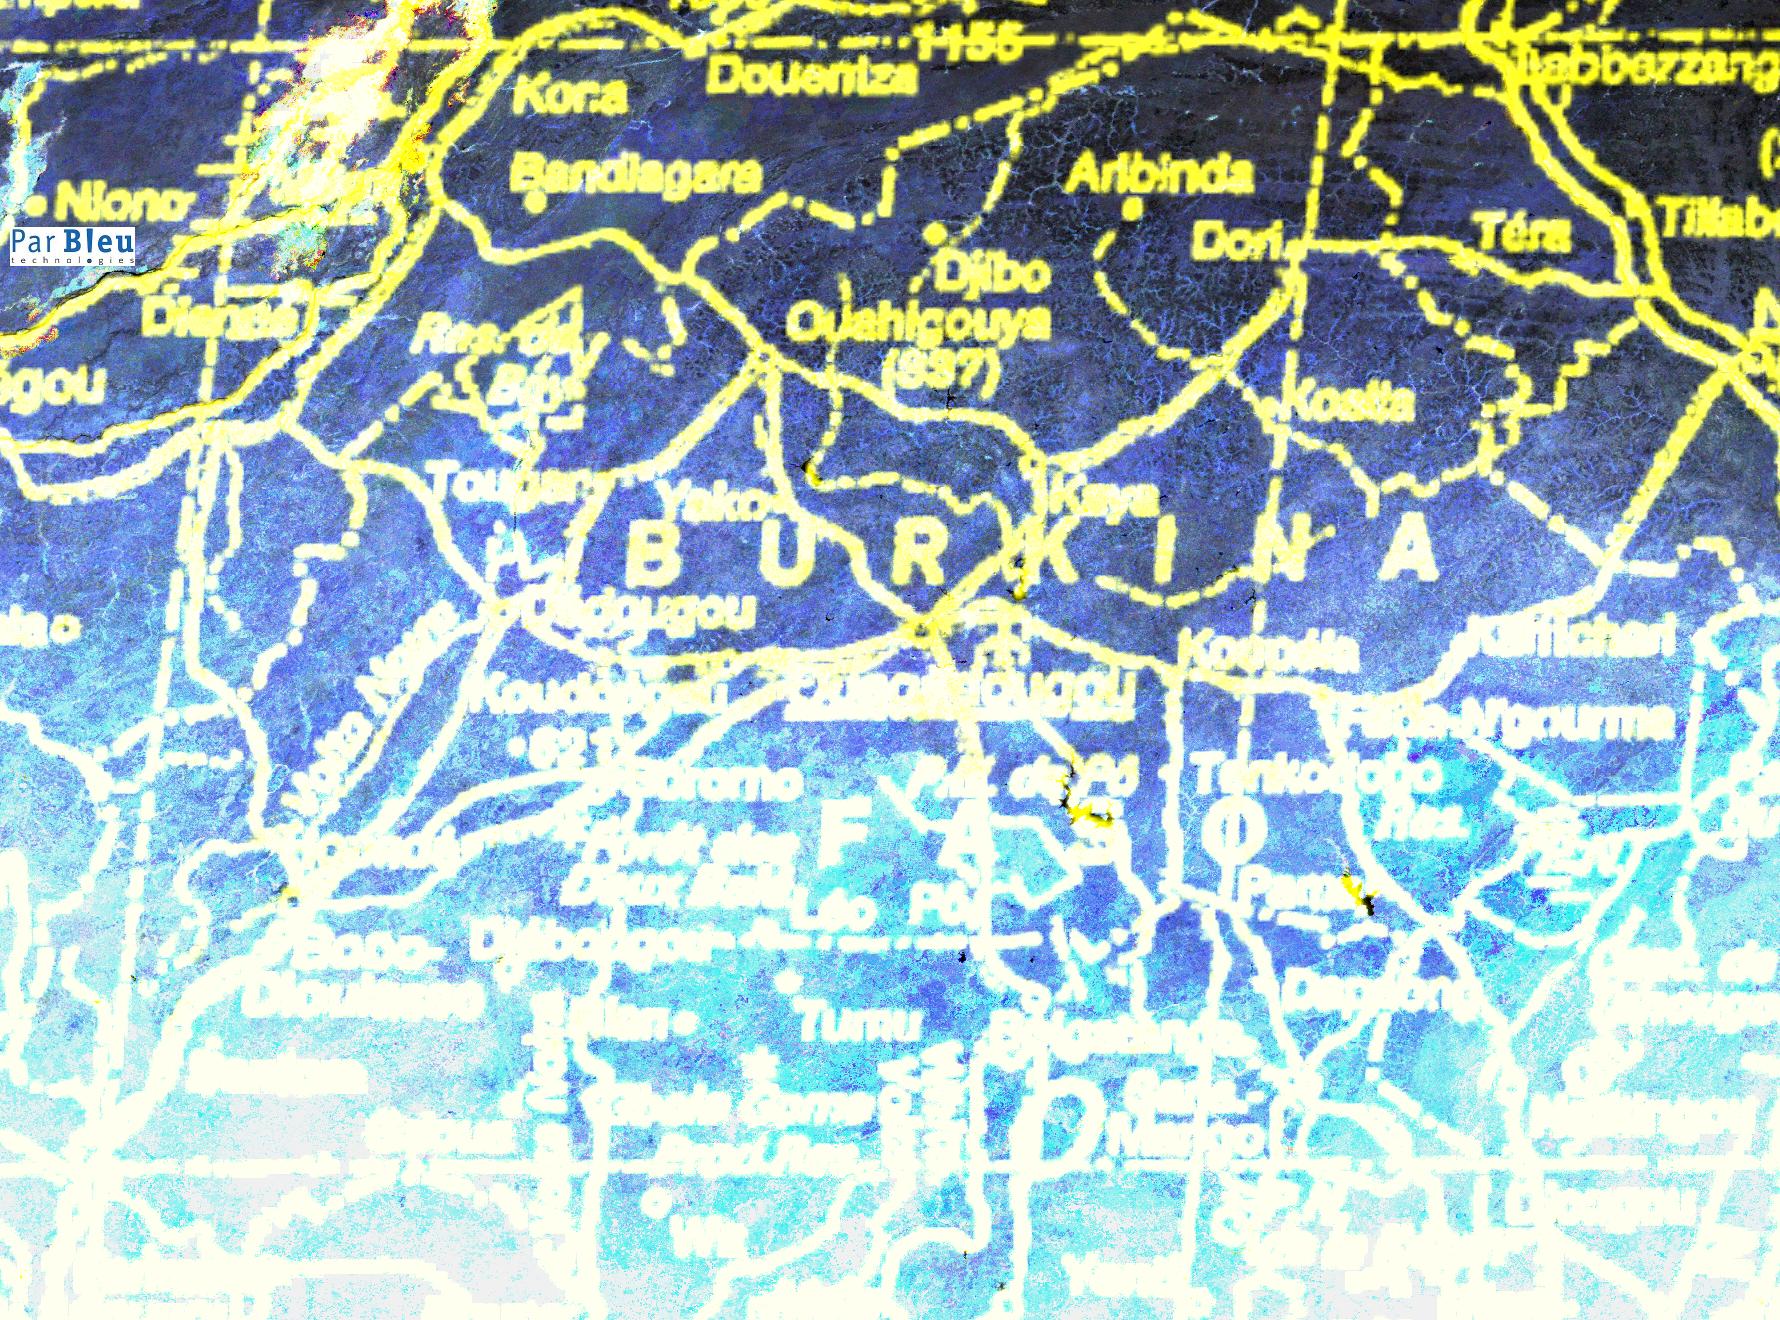
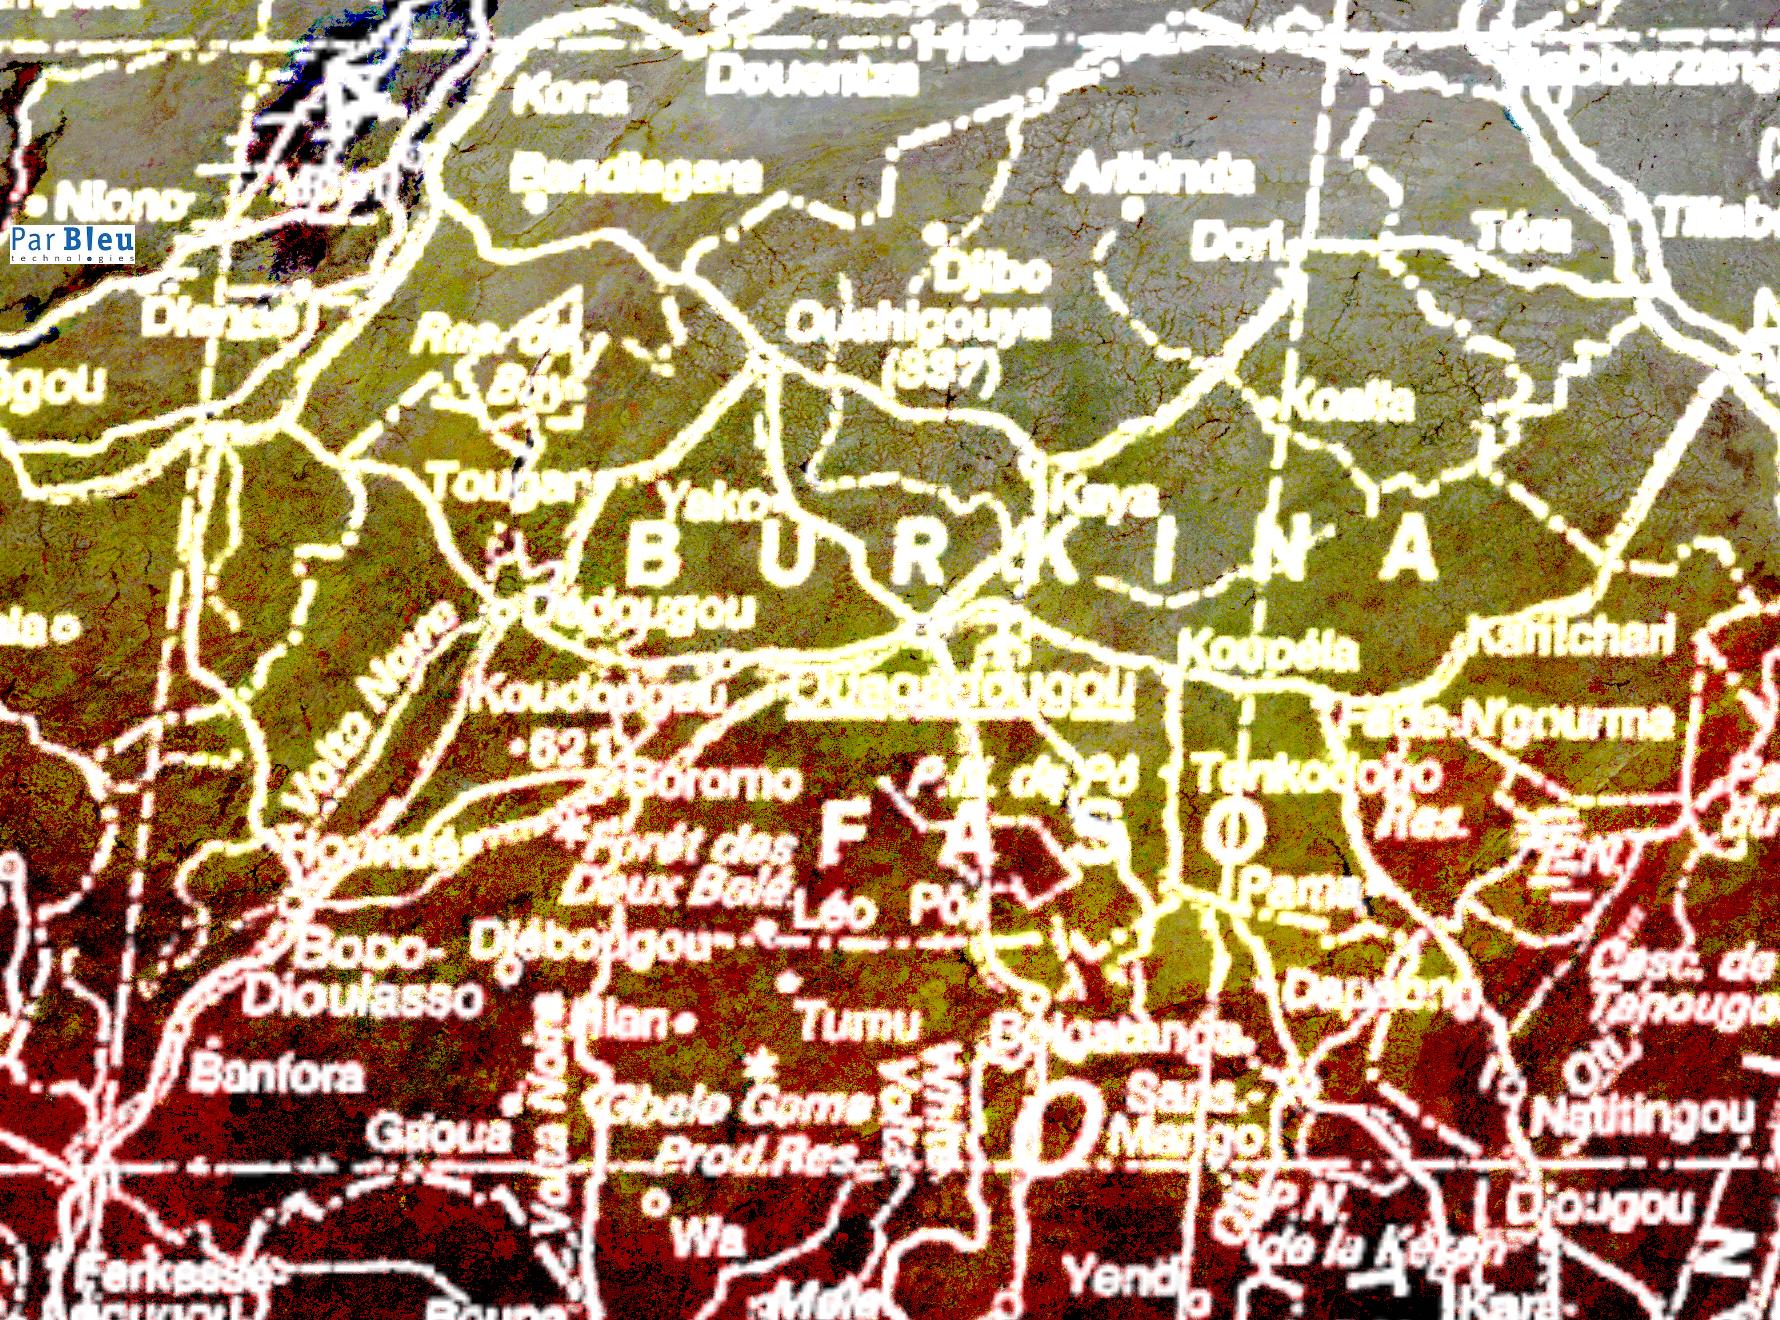
The monitored area extends over 660 x 890 kilometers. It englobes all of Burkina Faso, as well as part of the neighbour countries.
The maps produced by ParBleu Technologies Inc. are presented in homolosine Goode's cartographic projection, with a spatial resolution of 500 meters x 500 meters.
These maps are destinated to be introduced within Geographic Information Systems dedicated, either to the monitoring of vegetation and crop growth in order to predict agricultural yields and production, or to the monitoring of environmental conditions in the framework of the battle against locusts.
The map below represents the evolution of the percentage of vegetation cover, between September and December 2004.
From this map, it is possible to retrieve the average monthly values of the percentage of vegetation cover, thanks to the digital pixel values:
| Image channel | Corresponding period |
| 1st (red channel) | November 16 - December 15, 2004 |
| 2nd (green channel) | October 15 - November 15, 2004 |
| 3rd (blue channel) | September 13 - October 14, 2004 |
The value of the percentage of vegetation cover can then be obtained as follows, through the simple relationship :
% (vegetation cover) = (digital pixel value - 40) / 2
The margin of error is estimated to +/- 10%.
The offset of 40 units has been introduced to enable the representation of the desert areas (without any vegetation).
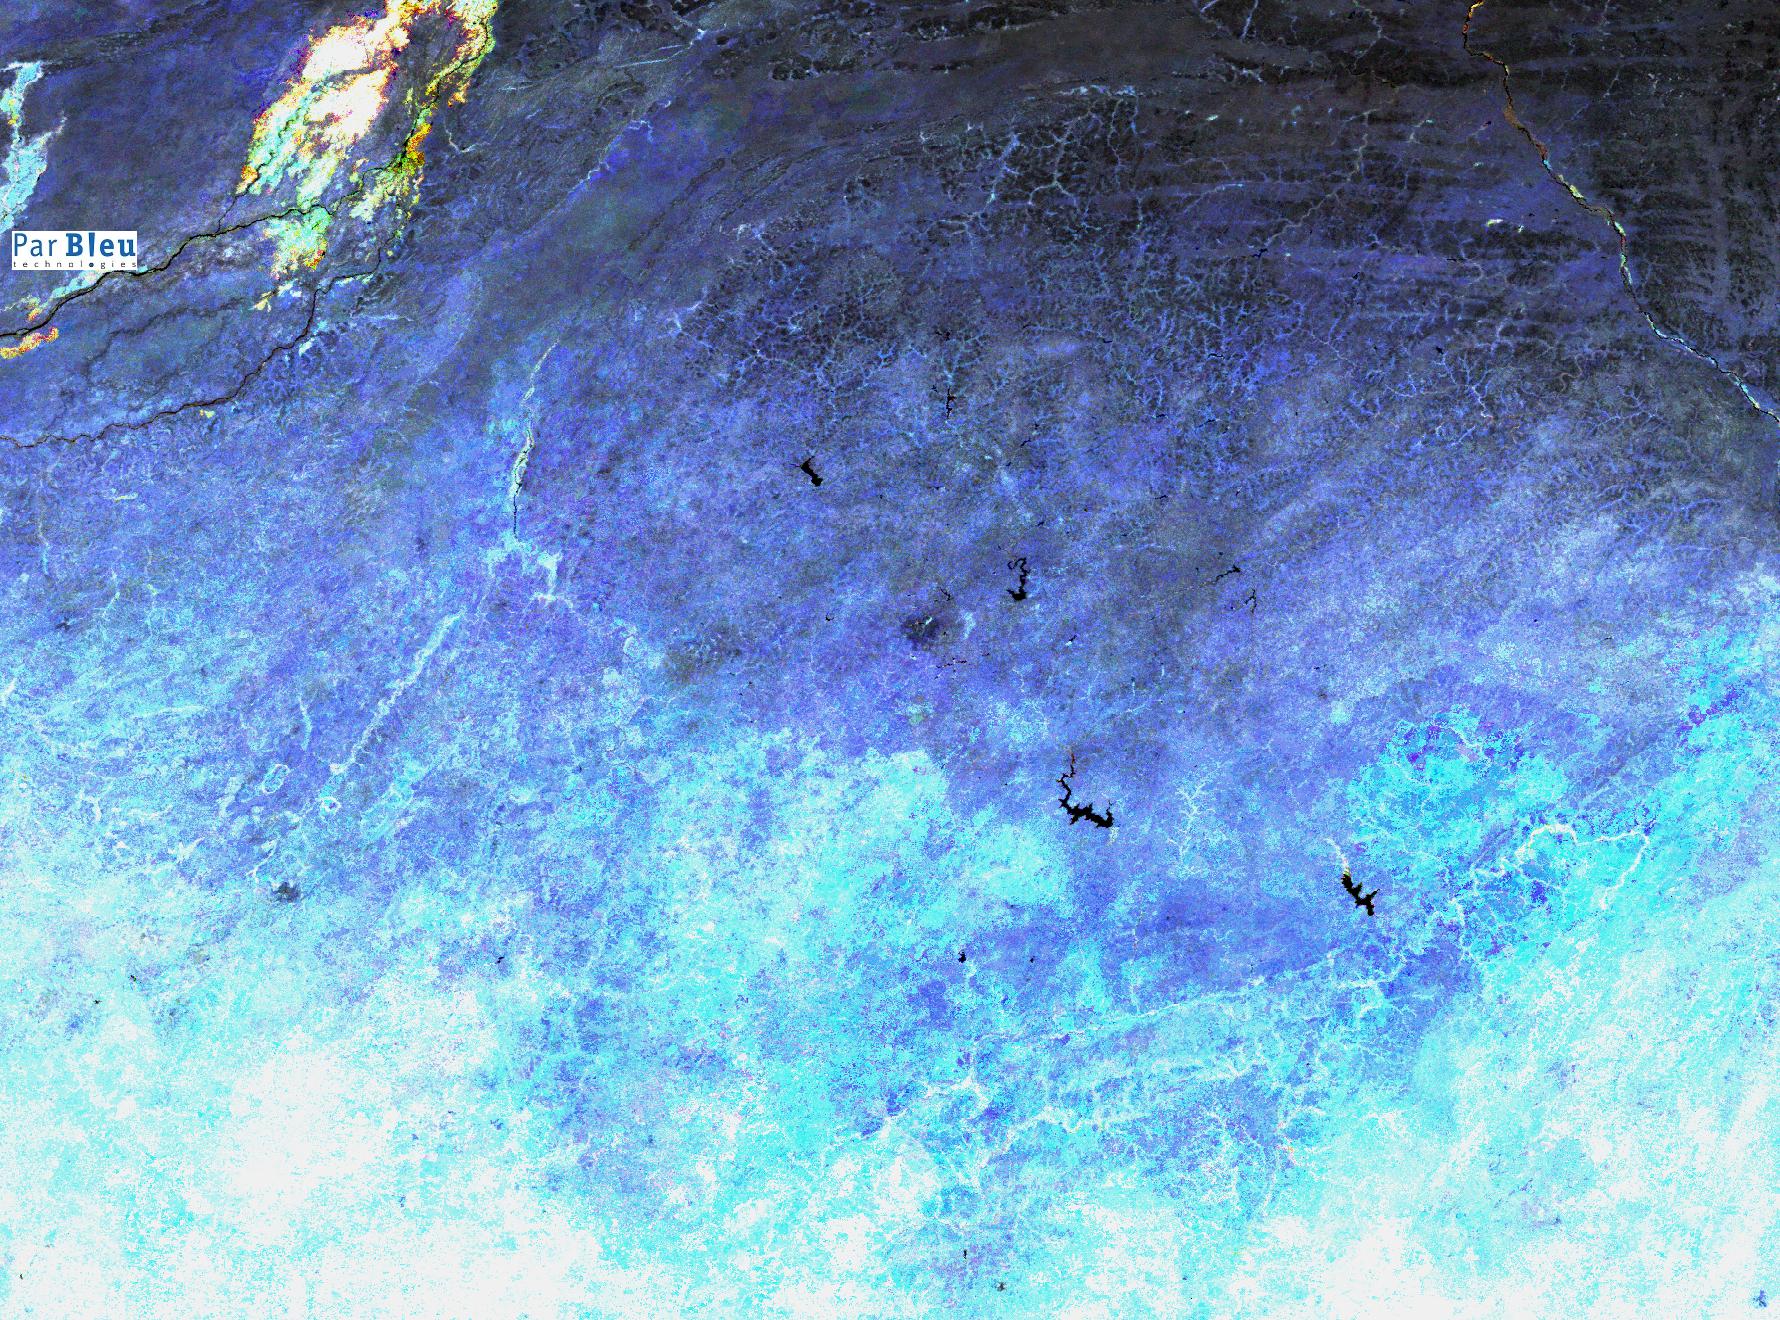
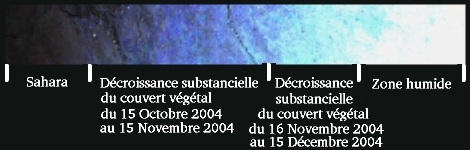
Areas exhibiting Blue tones are the areas where the vegetation cover has constantly decreased during the observation period.
Areas exhibiting other tones (very limited in extent) are the ones where some vegetation growth has been observed, mainly in November-December 2004.
The map hereunder represents the evolution of hydric stress between September and December 2004.
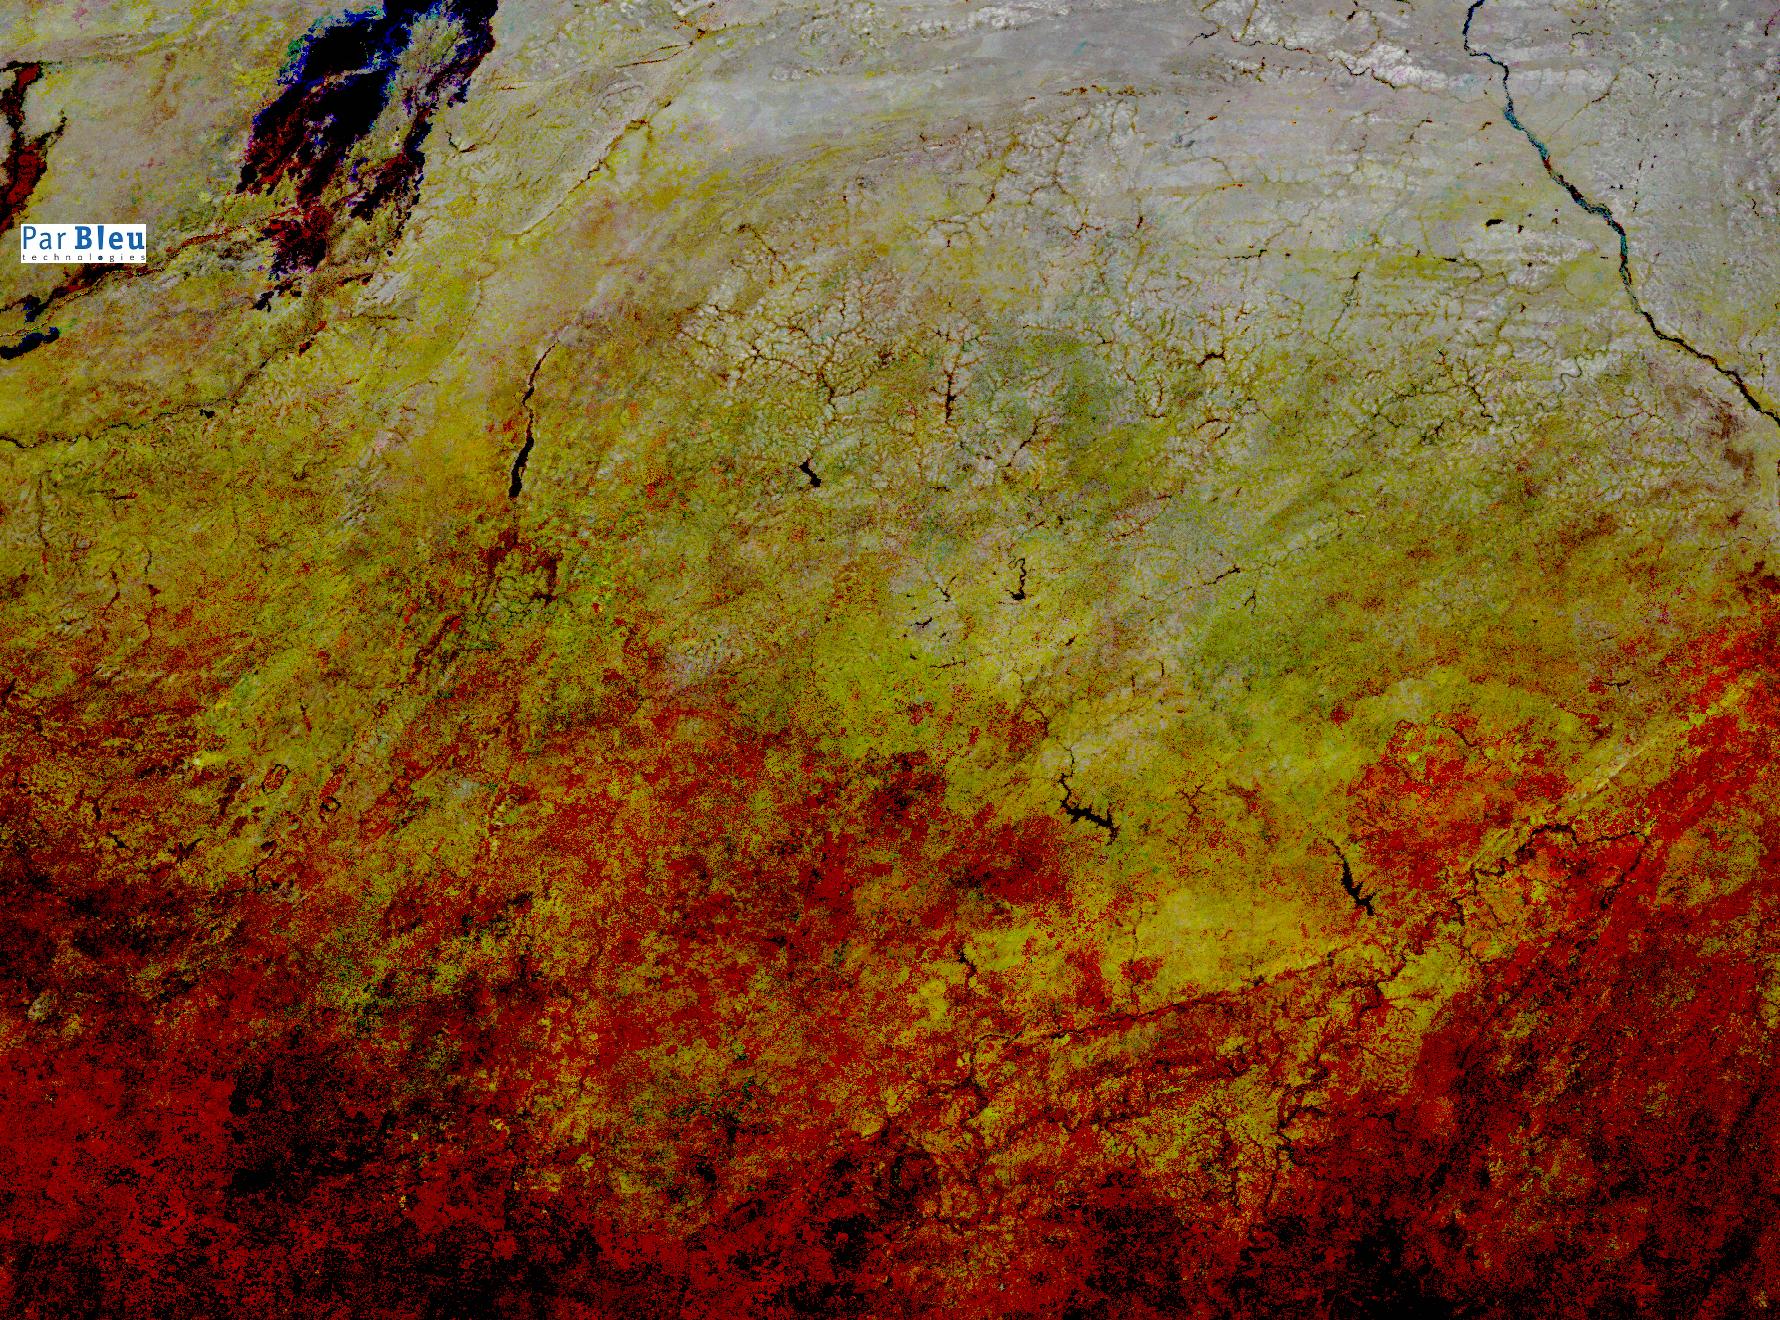
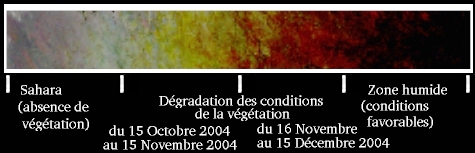
In the absence of calibration data, it has not been possible to establish a quantitative relationship between pixel values and the soil moisture content (Hydric stress increases with the pixel values).
Calibration measurements would allow to establish such a relationship enabling the quantitative estimation of soil moisture content.
From this map, it is possible to retrieve the average monthly values of our hydric stress index, thanks to the digital pixel values :
| Image channel | Corresponding period |
| 1st (red channel) | November 16 - December 15, 2004 |
| 2nd (green channel) | October 15 - November 15, 2004 |
| 3rd (blue channel) | September 13 - October 14, 2004 |
Produced by PARBLEU TECHNOLOGIES Inc. under mandate of the Canadian Space Agency.
(Standing Offer for Disaster Management Information Products and Services; PWGSC File Number 9F028-014927/008/ST)
Procurement of the TERRA/AQUA MODIS imagery ('MODIS 32-day Global Composites' products)
Courtesy of the University of Maryland, 'Global Land Cover Facility' (URL: http://glcf.umiacs.umd.edu)
Operational partners of PARBLEU TECHNOLOGIES Inc. :
 |
 |
 |
| Privateers NV | Treemail | AP Formation |
Copyright (C) PARBLEU Technologies Inc., 2005