
|
The (speckle filtered) images and the damage assessment map below (processing by ParBleu Technologies Inc.) are produced in cartographic projection UTM WGS 1984 (Zone 37), at a spatial resolution of 20 meters x 20 meters.
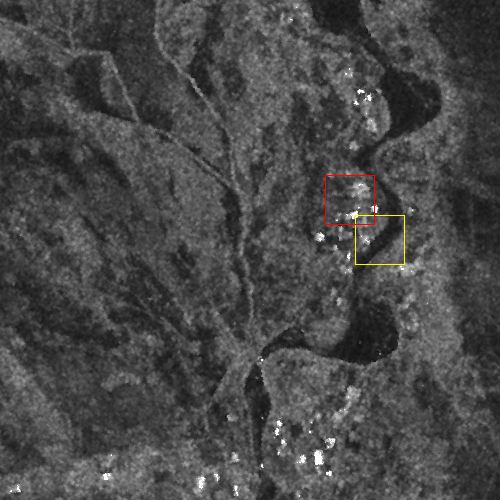
The (speckle filtered) images below cover a 10 km x 10 km area, located along the Gash River, ca. 10 km north of Kassala.
| Archive RADARSAT-1 Image (1999) | RADARSAT-1 Image (24 August 2003) |
 |
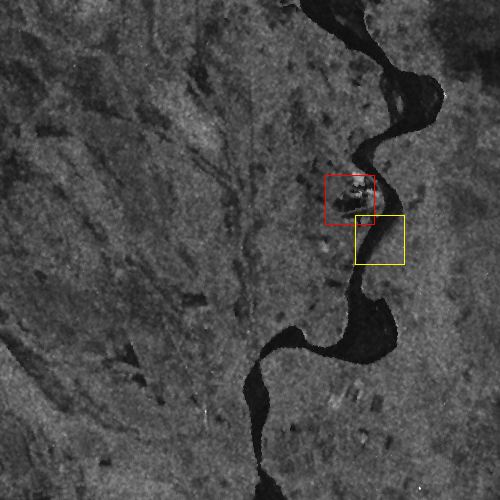 |
The brighter areas correspond to moister soils.
Therefore, the areas that went brighter in the RADARSAT-1 image acquired on August 24, 2003 show an important excess in water content with respect to the 1999 situation.
This effect affects an important fraction of the cultivated areas.
Bright dots correspond to houses.
On both sides of the Gash River, almost all the houses that were visible in 1999 have disappeared on August 24, 2003.
They are assumed to have been heavily damaged, or even destroyed.
In the area indicated in red, the location of a former settlement has been entirely flooded (black area).
In addition, a comparison of the two images shows that the bed of the Gash river has been modified by the floods.
The size of the area shown is 10.0 x 10.0 kilometers.
UTM geographic coordinates are indicated on the map.
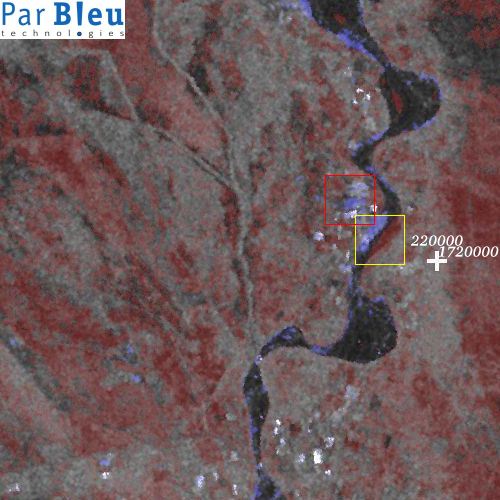
Interpretation keys :
On this map, the areas exhibiting blue tones correspond to the areas that have been flooded.
The areas exhibiting red tones correspond generally to soils presenting a strong excess in moisture content.
Agricultural fields located within such areas are likely to be heavily damaged. It is clear that an important part of the agricultural fields have suffered from the effect of heavy rainfall and/or floods.
Urban areas exhibiting blue tones correspond to damages suffered by housing.
Almost all houses on both sides of the Gash river have disappeared on August 24, 2003 (indicated as bright blue dots on the map).
In the area indicated in red, a former settlement, now entirely flooded, is highlighted in light blue tones.
On the shores of the river, light blue tones can also correspond to eroded terrains.
Also, dark red tones can also correspond there to sedimentation.
The combination of these light blue and dark red tones allows to measure the modification of the course of the Gash river after the floods.
As an example, within the area indicated in yellow, the bed of the Gash river has moved 360 meters westward.
Areas exhibiting grey tones are those which have not been affected by the rains and the floods.
Produced by PARBLEU TECHNOLOGIES Inc. under mandate of the CANADIAN SPACE AGENCY.
(Standing Offer for Disaster Management Information Products and Services; PWGSC File Number 9F028-014927/A)
Procurement of the original RADARSAT-1 SAR data: Canadian Space Agency, and Radarsat International Inc.
Original RADARSAT-1 images: Copyright Canadian Space Agency / Agence Spatiale Canadienne, 2003.
Copyright (C) PARBLEU Technologies Inc., August 2003