Complementarity of ERS and RADARSAT SAR's:
Environmental survey of The Netherlands in winter
Data Fusion
Data fusion is based on the principles of control systems. Each step of this
processing is designed as a control process, and is piloted by theoretical
models used as a set of commands.
A cascade of commands / controls processes allows the retrieval of
a wide range of geophysical parameters characterizing the environmental
situation, using the physical complementarity between the two
sensors (here the complementarity is provided by different polarization
configurations of the incident radar waves emitted by the two SAR's).
-
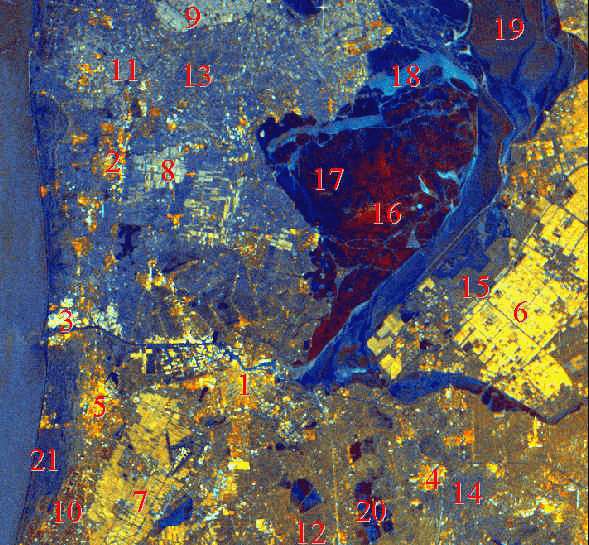
Low resolution (100x100m). Green: texture component of the two SAR images.
Red: soil roughness channel. Blue: soil moisture channel.
Such
a product can be produced at any resolution from 12.5x12.5 to 100x100
meters per pixel. (© Privateers NV 1996.)
This image is the result of data fusion using two images acquired by two different
Synthetic Aperture Radars (SAR): the C-HH band SAR onboard the Canadian RADARSAT-1
satellite (February 13, 1996), and the C-VV band SAR onboard the European ERS-2 satellite
(February 14, 1996).
The surveyed area is the southern part of The Netherlands (64 km
x 55 km), centered around the city of Amsterdam. Note that during most of the
winter this area is often covered by clouds which hinder the acquisition of useful
optical or near infra-red satellite imagery.
The green, red and blue channels are formed using control system based processes.
The green channel is formed during the multi-channel filtering process which is
itself a controlled process that implies data fusion aspects.
The red and blue channels are produced using physical models describing the
concerned geophysical parameters.
This representation enables, either
by photo-interpretation (guided by radar physics knowledge), or by automatic
computer-based process :
- to provide an immediate synoptic view of the environmental conditions
affecting the area, and to evaluate their impact,
- to identify the main agricultural cultivations, and get a very
early estimate of their extent,
- to retrieve a quantitative evaluation of soil moisture and soil roughness
(blue: soil moisture map, red: soil roughness map) to integrate into an
agro-meteorological model for continuous monitoring of crop growth and update
of crop yield forecast.
Related Publications:
- E. Nezry, F. Yakam-Simen, I. Supit and F. Zagolski, 1997:
"Retrieval
of environmental and geophysical parameters through Bayesian fusion of ERS and RADARSAT data",
Proceedings of the 3rd ERS Symposium, Florence (Italy), 17-21 March 1997.
- E. Nezry, F. Zagolski, A. Lopes, F. Yakam-Simen: "Bayesian filtering of
multi-channel SAR images for detection of thin details and data fusion", Proceedings
of SPIE, Vol. 2958, pp.130-139, Sept. 1996.
Interpretation / Environmental conditions
Some examples of interpretation, corresponding to the marked areas of
the above image are given, to illustrate the variety of information regarding:
- The cities of Amsterdam (1), Alkmaar (2), Ijmuiden (3), Hilversum (4), Haarlem (5)
- Agricultural fields, recently ploughed and with low moisture content (6, 7: sugar beets,
potatoes, cereals)
- Agricultural fields, recently ploughed and with high moisture content or covered by snow (8, 9)
- Agricultural fields, already prepared during the last fall, and with low moisture content
(10: tulip flowers)
- Agricultural fields, already prepared during the last fall, and with high moisture content
or covered by snow (11)
- Meadows and pastures with low moisture content (12)
- Meadows and pastures with high moisture content or covered by snow (13)
- Forest (14, 15)
- Thick ice (16)
- Thinner ice (17)
- Free water under wind conditions (18)
- Calm free water (19)
- Partly (blue) or totally (black) frozen lakes (20)
- Sand dunes along the shores of the North Sea (21)
- Snow covered areas: all blue areas in the northeastern part of the image. The snow cover
limit is easy to identify, north of Amsterdam and west of the IJsselmeer (the great North Sea
gulf inside Holland),
- The climatic difference between the northern and the southern part of Holland are
emphasized in this representation.
To Whom is Such a Product Useful
Note that the two acquisitions have been done in two days. This methodology has
been developed in order to provide an answer to an issue which concerns, sometimes
dramatically (natural hazards, etc.), the decision-makers at the regional or local scale.
This issue is the very rapid (in real- or near-real-time) evaluation of a global
situation, with regard to a very wide variety of aspects.
The most important of these aspects are:
- Risk assessment and prevention of natural hazards such as floodings,
- Road, waterways and maritime traffic security and management,
- Agriculture survey and dynamic forecasting of crop surfaces,
- Management of water resources.
With its research progresses, ParBleu Technologies Inc. and its partner company
Privateers NV are ready to provide responsible decision-makers with a service or/and
with the tools which would enable them to evaluate with the due rapidity the impact
of critical situations such as floodings, natural hazards affecting agriculture, etc.
Credits: These results have been obtained in the framework of Privateers NV Pilot
Projects:
- ERS pilot project PE-FRNE2, awarded by the European Space Agency (June 1996)
- RADARSAT pilot project ADRO#581 awarded by the Canadian Space Agency (February 1996)
|